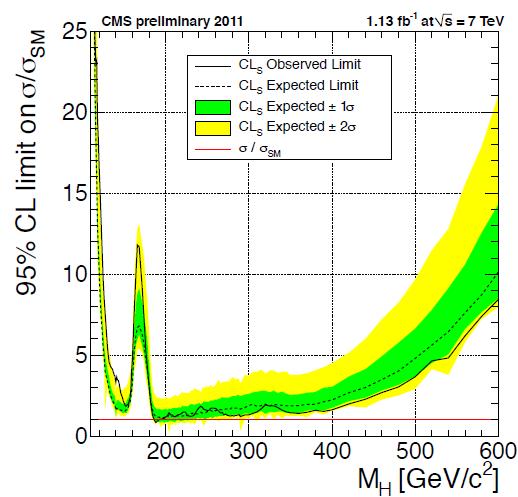
Well... If you look at some of the distributions that went into the final result, you can see nice looking colored histograms that come from the monte carlo, and little black crosses representing the data. And one of those little black crosses is on the left hand side of the peak representing background expectations. That means in the lower mass region, where we tend to have lots more data. Let me emphasize that again: until you start applying cuts on the data (muon isolation, jet Et > some value, and so on), that region of the mass plot has many orders of magnitude more data than the right hand side (high mass). The plot doesn't look like a hill in the middle of a field, but like an insane ski slope falling from left to right.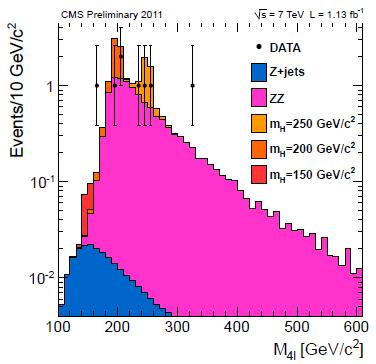
The monte carlo (random number estimators of the background, in this case) distribution we show rises very sharply on the left and falls more slowly on the right, and that lonesome data point is sitting where you don't expect much of anything--hence you get a spike in the final plot. The "gentle" slope is on the right and the cliff is on the left--and there's a datapoint out past the edge of the cliff. 10 events when you expect 8 is a yawner, but 1 when you expect 0 seems dramatic.
But this is very sensitive to how well you modeled your background. Suppose you goofed, and that sharply rising left side should really rise more slowly--meaning you expect more events at the low mass end. Now you see 1 event when you expect 1/3 (for example), which is nothing to write home about.
Expecting 1/3 of an event means something like this: If you triple the beam time you expect 1 event, or if you do the same experiment 3 times you expect to see 1 event--at some confidence level. Taking such small probabilities into account is important. Suppose there's a lottery drawing with 100 tickets. You have 1, Joe has 10, Ann has 15, and so on. Your chance of winning is 1/100 (pretty small), Ann's is 3/20 (not huge), and so on. But when you add up all those small probabilities you get 1--which in this case means somebody will win. (The experiment has no such guarantee, of course.)
So what could go wrong in the background modeling? All sorts of things, many of which are shared between CMS and Atlas, such as the parton distribution functions. "Partons" are the generic name given to quarks and gluons inside a nucleon. They appear and annihilate with amazing ease, and the fraction each one is likely to carry of the total proton momentum is the distribution function.
Little things can make a large difference when modeling large backgrounds. Recently CDF announced an anomalous peak where nobody was expecting one. D0 said they didn't see it, and a joint team is working on reconciling the difference. Rumor has it that the issue may be a difference in "jet energy corrections" for quark jets and gluon jets, and that the peak gets a lot smaller if you re-estimate the corrections.
Jets from an energetic gluon tend to be a little wider than those for quarks of the same energy, and since we use the same cone size for all kinds of jets (we don't a priori know which is which) the gluon jet will be measured slightly low. The corrections are needed because jets are extremely messy things. The E/M (electron and gamma) energy is typically measured very well in the E/M calorimetry and not so well in the hadronic calorimetry, so you need to correct the hadronic energy component a bit to get the correct total energy. There are also losses due to neutrons escaping from the hadronic calorimeter--you don't know what they are so you have to include some kind of average correction term. And there's random energy from other stuff in the cone that you have to subtract out.
Update: I added some plots that I swiped the links for from Dorigo's site, which actually come from his work area. He's a very good source about CDF and CMS work.
No comments:
Post a Comment